homework 10: the cycle of twelve
In a variety of biological systems, there are genes with expression levels that oscillate in a circadian rhythm. There are different ways that a transcriptional oscillation can be generated. One way is a regulatory cascade of transcription factors, where TF1 at time 1 activates TF2 at time 2, and so on down a line. By tuning rates of synthesis, degradation, activation, and repression, an oscillator of a particular period can be evolved, such as a 24 hour circadian period.
Lestrade has been studying a "persistent" phage with unusual properties. Persistent phage are phage that are neither lytic nor lysogenic, but instead set up a chronic infection and continuously produce phage particles while keeping the host bacterium alive. Lestrade's phage appears to have a transcriptional circadian oscillator, with phage production oscillating daily.
Lestrade has identified a set of 12 phage genes with mRNA expression levels that vary cyclically in a 24 hour period, in different phases. However, their phases relative to each other remain unknown. The phase information is critical. If the 12 phases were known, then the 12 genes could be ordered into a relative order of activation. This would allow Lestrade to make testable predictions about which gene products are most likely to be 'upstream' in the regulatory pathway and directly regulating transcription of which 'downstream' genes.
the available data
Unfortunately, Lestrade's lab skills are not the best. He's collected RNA-seq data sets for several time points, but with different quality. He's collated his data into a table (which you can download from here too):
| gene | 4hr, +-20 | 4hr, +-2 | 8hr, +-20 | 8hr, +-5 | 16hr, +-5 | 16hr, +-20 | 24hr, +-2 | 24hr, +-20 |
|---|---|---|---|---|---|---|---|---|
| wkiN | 46.91 | 46.55 | 49.38 | 64.63 | 48.48 | 49.01 | 30.71 | 24.80 |
| wicQ | 35.27 | 21.65 | 11.59 | 41.64 | 56.33 | 22.75 | 17.78 | 32.35 |
| zgvC | 8.15 | 22.10 | 21.27 | 27.50 | 64.60 | 79.56 | 44.67 | 44.80 |
| dczC | 56.80 | 74.45 | 42.10 | 47.14 | 27.08 | 26.62 | 71.73 | 93.36 |
| jarO | 73.63 | 64.03 | 92.24 | 60.41 | 23.81 | 24.71 | 44.66 | 10.19 |
| lfpY | 16.58 | 30.58 | 25.31 | 22.27 | 48.61 | 38.77 | 55.01 | 53.45 |
| retS | 56.69 | 47.92 | 38.73 | 24.26 | 51.48 | 45.60 | 70.12 | 52.28 |
| cbaJ | 67.61 | 70.74 | 50.69 | 53.99 | 29.63 | 3.30 | 57.78 | 3.05 |
| vdbK | 46.92 | 53.57 | 36.90 | 35.26 | 37.93 | 33.05 | 63.00 | 45.72 |
| slwZ | 68.98 | 59.26 | 44.09 | 79.95 | 28.23 | 5.61 | 35.46 | 50.07 |
| wjmU | 33.36 | 33.57 | 104.52 | 63.71 | 63.12 | 63.35 | 19.34 | 40.88 |
| uhxN | 48.88 | 22.50 | 48.75 | 36.31 | 69.64 | 52.63 | 34.58 | 29.21 |
There are a total of 8 experiments, with two experiments each at time points at 4, 8, 16, and 24 hours, as marked in the first line of bold column headers. The numbers in the table are estimated expression levels in TPM for the 12 genes.
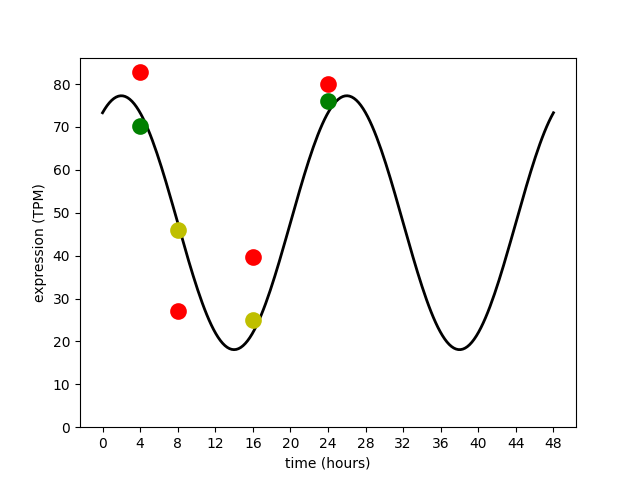 An example of a phage gene being expressed in
a circadian rhythm, with a period of 24 hours.
The true average oscillation in expression level is shown with
the black line. The eight available experiments have measured this gene's
expression at 4, 8, 16, and 24 hour time points.
Two experiments are accurate with low variance (green dots);
four experiments are inaccurate with high variance (red dots);
two experiments are intermediate (yellow dots).
An example of a phage gene being expressed in
a circadian rhythm, with a period of 24 hours.
The true average oscillation in expression level is shown with
the black line. The eight available experiments have measured this gene's
expression at 4, 8, 16, and 24 hour time points.
Two experiments are accurate with low variance (green dots);
four experiments are inaccurate with high variance (red dots);
two experiments are intermediate (yellow dots).
The catch is that Lestrade's measurements have different reliabilities, as indicated in the second line of bold column headers marked +-20, +-2, and +-5. This variability is partly because different numbers of replicates were done, and partly because some experiments were more careful than others.
For the purposes of the exercise, we will assume that the errors in TPM measurements are Gaussian-distributed with these known standard deviations \(\sigma\). For example, the first experiment is a 4hr time point, with normal error \(N(0,\sigma=20)\). There are two high accuracy experiments with \(\sigma = 2\) at 4hr and 24hr points; four low accuracy experiments (\(\sigma = 20\)); and two moderate accuracy experiments (\(\sigma = 5\)). Note that I'm not worrying about RNA-seq mapped read counts being better fit by a negative binomial or lognormal distribution. For the purposes of the pset, to keep things simple and focus on the main point, we'll assume that Lestrade's TPM measurements are Gaussian-distributed.
You can assume that the underlying model for an cyclic expression level \(y_t\) for a gene at time \(t\) (in hours) is
in terms of three parameters: a baseline mean expression level \(b\) (in TPM), an oscillation amplitude \(a\) (in TPM), and a phase \(\phi\) (offset, in hours). You can treat the circadian frequency \(\omega\) as known, \(\frac{1}{24\mathrm{hr}}\). Note that the term \(2 \pi \omega (t + \phi)\) ends up in units of radians. That's a hint. Don't confuse hours and radians in implementing this exercise!
The game is to deduce the unknown phases \(\phi\), given this small amount of Lestrade's RNA-seq data of variable reliability, and thereby deduce the correct relative order of the 12 genes. (If mRNA1 has a \(\phi\) +2hrs of mRNA2, that means mRNA1 starts to rise two hours before mRNA2 does, and thus is more likely to be a direct regulator of mRNA2 transcription, as opposed to the other way around.)
Moriarty's solution
Moriarty, the brilliant postdoc in the lab who's a bit full of himself, says he's seen this problem before. He says it's called a harmonic regression problem. He lets you know that he's familiar with a clever and widely used trick for it. The equation above for \(y_t\) is nonlinear in \(\phi\) (because of the \(\sin\)), but Moriarty reminds you of angle addition formulas from trigonometry, one of which is:
If we apply that to the modeling equation for \(y_t\) we can get a linear regression function with three parameters:
where those three parameters are:
The function is nonlinear in \(t\), but it's linear in the parameters, which is what matters for solving for \(\phi\). Moriarty condescendingly tells you that once we're in this form, we can just solve for the parameters with ordinary least squares. Given a least squares fit for the parameters, \(\frac{p_2}{p_1} = \tan(2 \pi \omega \phi)\) and we can use \(\arctan\) to solve for \(\hat{\phi}\); then given \(\hat{\phi}\), we can get \(\hat{a}\) from either \(p_1\) or \(p_2\).
Moriarty's script, which you can download here, takes the data table as input, and does an ordinary least squares fit for each gene's expression data to obtain best fit \(\hat{b}\), \(\hat{a}\), and \(\hat{\phi}\). Ordering the results by \(\hat{\phi}\), Moriarty deduces that the pathway order appears to be:
| gene | b (tpm) | a (tpm) | phase \(\phi\) (hr) |
|---|---|---|---|
| jarO | 43.96 | 35.18 | 22.44 |
| wkiN | 45.58 | 17.02 | 19.53 |
| wjmU | 55.55 | 33.16 | 18.67 |
| uhxN | 46.26 | 15.10 | 15.60 |
| wicQ | 31.60 | 6.80 | 14.50 |
| zgvC | 45.91 | 29.74 | 12.45 |
| lfpY | 38.26 | 19.20 | 9.59 |
| retS | 48.19 | 17.17 | 7.83 |
| vdbK | 42.27 | 12.71 | 5.74 |
| dczC | 49.64 | 30.40 | 5.07 |
| slwZ | 40.55 | 26.10 | 0.32 |
| cbaJ | 36.32 | 26.35 | 0.09 |
But even as Moriarty goes around the lab crowing about his solution and designing incisive new experiments based on his brilliant deduction of the order (or so he says), you're not quite convinced. The uneven reliability of the eight experiments bothers you. You're not sure the implicit assumptions of least squares fitting have been met.
1. solve by maximum likelihood
Given the RNA-seq data, use maximum likelihood to solve for the unknown phases \(\phi\).
For each gene independently, you'll need to calculate a log likelihood \(\log P(\mathrm{data} \mid \theta)\), where the observed data are the expression levels in the 8 experiments, and the parameters include the unknown parameters \(b\), \(a\), and \(\phi\) you want to find, plus the known parameters \(\sigma\) for each experiment.
Then you want to identify ML estimates \(\hat{a}\), \(\hat{b}\), and \(\hat{\phi}\) for each gene, by identifying the parameters that maximize the log likelihood.
You could discretize (as we've done before) and enumerate a grid
search over a range of parameter values, but with three parameters in
play, that'd get to be tedious. Instead, this week it's time to learn
a new trick: let's solve this one using multidimensional optimization
using SciPy's optimize.minimize() function.
The interface to calling any general library's optimization routine
(SciPy or otherwise) is always finicky. You give it your objective
function (here, your log likelihood calculation) in a general form, so
SciPy can call it blindly and doesn't need to worry about what
anything means. All it needs to do is start from an initial guess at a
parameter vector \(\bar{p}\) (provided by you) and move \(\bar{p}\)
around in parameter space, calling the objective function you provided
every time it moves to a new point, until it finds a point \(\bar{p}\)
such that your objective function \(f(\bar{p})\) reaches an
optimum. There's a ton of art in making optimizers work properly, but
since that's been done for you in SciPy, essentially all the art (from
your point of view) is in figuring out the interface to
optimize.minimize(). Documentation for it is
here,
and see the hints at the end for an example.
2. compare solutions
Moriarty is incensed that you have a different solution. He offers to bet you on who's right. Compute the total log likelihood (summed over all 12 genes) for Moriarty's solution and yours. Which is more likely, and by how much? If Moriarty offers you even odds on his bet, should you take it?
3. plot the fits
For each of the 12 genes, plot the observed data and the two fits (so you can show Moriarty how he went wrong, after taking his money from the bet).
(You can use something like a 3x4 multipanel figure in matplotlib.)
allowed modules
Our list of allowed modules now includes re (regular expressions), and scipy.optimize (the SciPy numerical optimizer), in addition to what we've previously used: NumPy, Matplotlib, Pandas, Seaborn, and SciPy's stats and special modules.
I use re for help in parsing the data file; np.linalg.lstsq() in
implementing Moriarty's harmonic regression along with tidbits like
np.pi, np.cos(), np.arctan(); scipy.stats.norm.logpdf() for
the log PDF of the Gaussian; and scipy.optimize.minimize() for
numerical minimization.
My imports, for example:
import numpy as np
import re
import scipy.stats       as stats
import scipy.optimize    as optimize
import matplotlib.pyplot as plt

%matplotlib inline
turning in your work
Submit your Jupyter notebook page (a .ipynb file) to
the course Canvas page under the Assignments
tab.
Name your
file <LastName><FirstName>_<psetnumber>.ipynb; for example,
mine would be EddySean_10.ipynb.
We grade your psets as if they're lab reports. The quality of your text explanations of what you're doing (and why) are just as important as getting your code to work. We want to see you discuss both your analysis code and your biological interpretations.
Don't change the names of any of the input files you download, because the TFs (who are grading your notebook files) have those files in their working directory. Your notebook won't run if you change the input file names.
Remember to include a watermark command at the end of your notebook,
so we know what versions of modules you used. For example,
%load_ext watermark
%watermark -v -m -p jupyter,numpy,matplotlib,re,scipy
hints
- Here is a heavily commented example of using
scipy.optimize.minimizeon a simple maximum likelihood optimization.