pset 05: the adventure of the telltale composition
Your lab has been doing metagenomic sequencing of phage in a soil environment that is dominated by some Microbacterium phage species, but which also has a small amount of some Streptomyces phage species. From sample to sample, about 99.9% of the sequencing reads are from the Microbacterium phage, and about 0.1% are from the Streptomyces. To facilitate genome assemblies of the rare Streptomyces phage, you and Moriarty are both working on developing a method for classifying individual DNA sequence reads as "Streptomyces type" vs. "Microbacterium type", based on sequence composition alone.
training and test data sets
The lab has settled on two SEA-PHAGE genomes as representatives of these two phage types, PapayaSalad and OscarSo. FASTA sequence files of the two genomes are here for you to download, for training your method:
- PapayaSalad: 38411 bp Streptomyces phage
- OscarSo: 33432 bp Microbacterium phage
The lab has also collected pure datasets of sequencing reads from each phage type that are available for testing:
- strep-test.fa: 10,000 reads of length 200 from the Streptomyces phage type (FASTA format)
- micro-test.fa: 10,000 reads of length 200 from the Microbacterium phage type (FASTA format)
Moriarty's method
Moriarty is already crowing about his secret proprietary machine learning method. He shows the following (apparently spectacular) result:
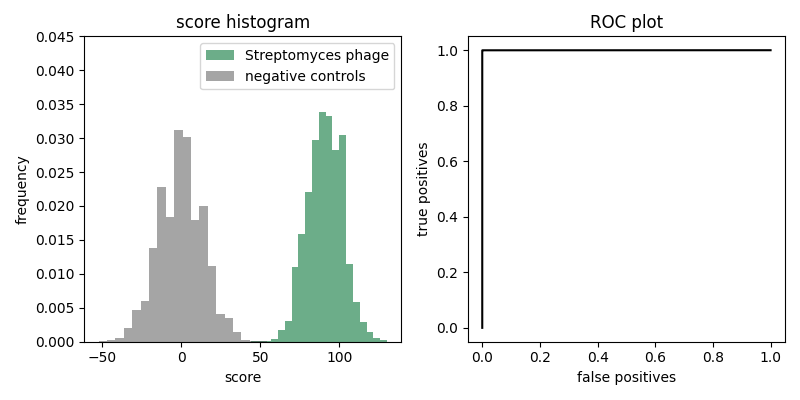
The histogram on the left shows results of scoring the 10,000 Streptomyces phage reads in strep-test.fa, compared to scoring 10,000 random sequences of uniform base composition (which are here if you want them). The figure on the right show the ROC plot derived from the score histogram. Moriarty proudly points to how the ROC plot shows that his secret proprietary machine learning method achieves perfect discrimination. He's already filed a patent and submitted a manuscript to Cell.
1. test Moriarty's method yourself
After some prying on your part, Moriarty reluctantly discloses that his secret proprietary machine learning method is to score +1 for each C or G, and -1 for each A or T.
You also note that Moriarty showed results for discriminating against random sequences (of uniform base composition), but the actual task is to discriminate between reads of the two phage types.
Implement Moriarty's secret proprietary machine learning method. Test it on the sequences in strep-test.fa and micro-test.fa. Make a plot of your own, showing a histogram and a ROC plot like in Moriarty's figure, but for performance in discriminating Microbacterium phage reads from Streptomyces phage reads.
What do you conclude? Why are your results different from Moriarty's?
2. make your own method
You think you can do better, using higher order Markov models.
-
Implement a second order Markov model (i.e. with parameters \(P(x_i | x_{i-1}, x_{i-2})\). )
-
Train (i.e. estimate parameters for) two models: one on the PapayaSalad genome, and one on OscarSo.
-
Implement a routine that calculate the log likelihood ratio score for a sequence read, for a comparison of the two models, given the read sequence and the two 2nd-order Markov models.
-
Plot the histogram and ROC plot for your 2nd-order Markov model method, for results of discriminating the test reads in strep-test.fa and micro-test.fa.
Is your Markov model better than Moriarty's method? Why do you think this is the case? Explain.
3. how good is your method?
Suppose the lab wants to achieve 90% sensitivity for detecting Streptomyces phage reads.
-
What score threshold would you need to set?
-
What is your estimate for the false positive rate at that threshold?
Remember that in a metagenomic sample, 99.9% of the reads are from the Microbacterium phage species, and 0.1% of the reads are from the Streptomyces phage species. Using your estimates above, if you use your method to classify reads, what proportion of the reads that you label as Streptomyces phage reads are actually false positives from the abundant Microbacterium phage? (This is your false discovery rate, FDR.)
Use Python code to answer these questions, using the results of your testing above. How good is your method at discriminating the two types of phage? Explain.
allowed modules
NumPy, Matplotlib, Pandas, Seaborn.
You need Matplotlib for the plotting, and NumPy at least for calculating logs. The others are optional (I don't think you need them but they're on our now-standard list of modules).
import numpy as np
import matplotlib.pyplot as plt
import pandas as pd                 # optional
import seaborn as sns               # optional

%matplotlib inline
list of data files
    wget http://mcb112.org/w05/PapayaSalad.fa
    wget http://mcb112.org/w05/OscarSo.fa
    wget http://mcb112.org/w05/strep-test.fa
    wget http://mcb112.org/w05/micro-test.fa
    wget http://mcb112.org/w05/moriarty-neg.fa
turning in your work
Submit your Jupyter notebook page (a .ipynb file) to
the course Canvas page under the Assignments
tab.
Name your
file <LastName><FirstName>_<psetnumber>.ipynb; for example,
mine would be EddySean_05.ipynb.
We grade your psets as if they're lab reports. The quality of your text explanations of what you're doing (and why) are just as important as getting your code to work. We want to see you discuss both your analysis code and your biological interpretations.
Don't change the names of any of the input files you download, because the TFs (who are grading your notebook files) have those files in their working directory. Your notebook won't run if you change the input file names.
Remember to include a watermark command at the end of your notebook,
so we know what module versions you used, in case we have to
reproduce some bug exactly. For example,
%load_ext watermark
%watermark -v -m -p numpy,matplotlib,seaborn,pandas,jupyter