pset 00: Moriarty's game of chaos
[Remember, this is just an example of what MCB112 psets look like - you don't have to turn it in. You'll start doing psets in week 01.]
You've just joined the Holmes lab. A senior postdoc in the group, Moriarty, is going around saying that he's discovered amazing hidden patterns in DNA sequences, using some mathematical technique from fractal geometry that only he is smart enough to understand. Seeing that you're new, he corners you and starts explaining.
the chaos game method
 A Sierpinski
triangle
generated with the chaos game (plotting 20000 points).
Moriarty says his method is called the "chaos game", which is why he was attracted to it in the first place. He says the rules of the chaos game are deceptively simple. Start with a triangle, he says, and put a random point anywhere in the triangle. Now iterate the following rule: choose one of the three vertices of the triangle at random, and plot a new point halfway along the line between the previous point and that vertex. Iterate that for a lot of points.
You'd think you'd get a uniformly distributed haze of points, but you don't! You get the figure at the right.
Now do the chaos game in a square, choosing one of four vertices at random at each iteration, and you do get a uniform haze of points, as shown in the next figure to the right.
 In a square, for randomly chosen vertices, the chaos game just
generates a uniform distribution of points.
Now comes the amazing thing, says Moriarty. Instead of using random numbers for choosing a vertex at each iteration, use a DNA sequence. Label the vertices of the square with A|C|G|T, and use the actual sequence of a genome to specify which vertex you move toward to plot each successive point. That is, in pseudocode:
    seq = input DNA sequence of length L, an array of A|C|G|T characters

    V = { 'A' : [0, 0], 'C': [0,1], 'G': [1,1], 'T': [1,0] }   # define vertices of a square

    p = V[seq[0]]                 # you could also start at a random point
    plot point p
    for i = 1 to L:
        p = (p + V[seq[i]) / 2    # p and V['X'] are 2D vectors; p + V['A'] is vector addition
        plot point p
Moriarty's results on phage genomes
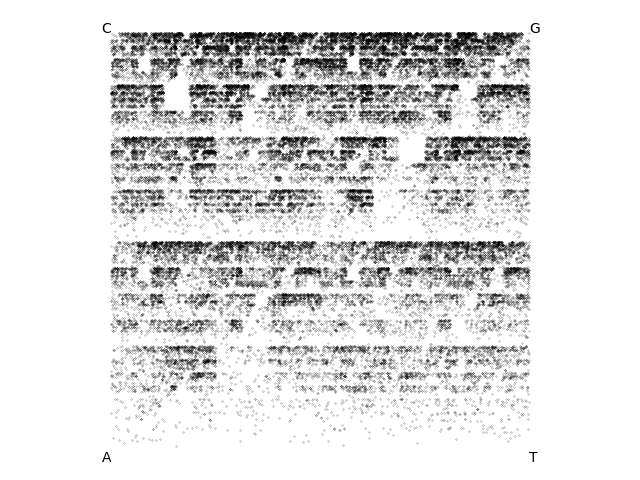
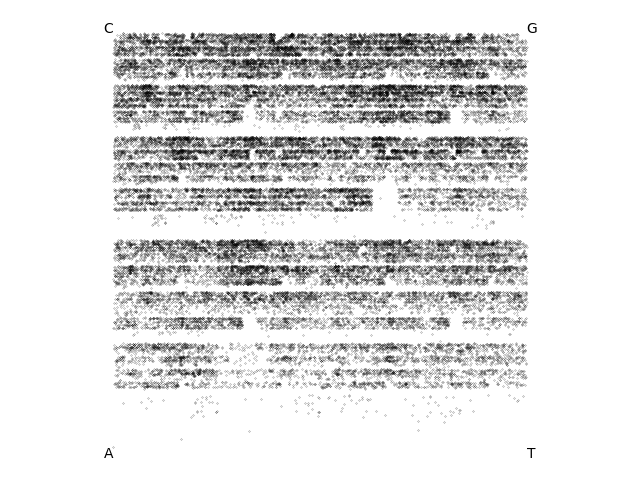
Moriarty shows you some of his results for phage genomes. Here are three examples:
BabyGotBac, a 57kb Streptomyces phage isolated by a SEA-PHAGES course at the University of North Texas:
Dwayne, a 52kb Streptomyces phage isolated by a SEA-PHAGES course at Washington University in St. Louis:
Tiamoceli, a 56kb Gordonia phage isolated by a SEA-PHAGES course at the University of Puerto Rico:
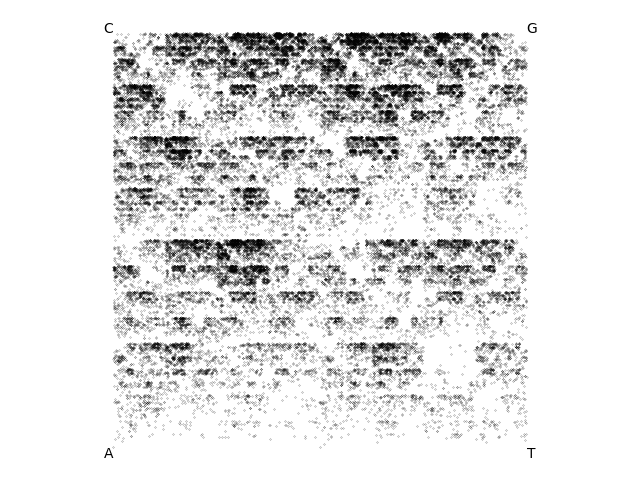
Moriarty says that obviously these inexplicable patterns mean that there's some sort of hidden meaning in genome sequences. He's been busy collecting more and more examples that he plans to show to the Nobel Committee in Stockholm.
Moriarty's revealing control experiments
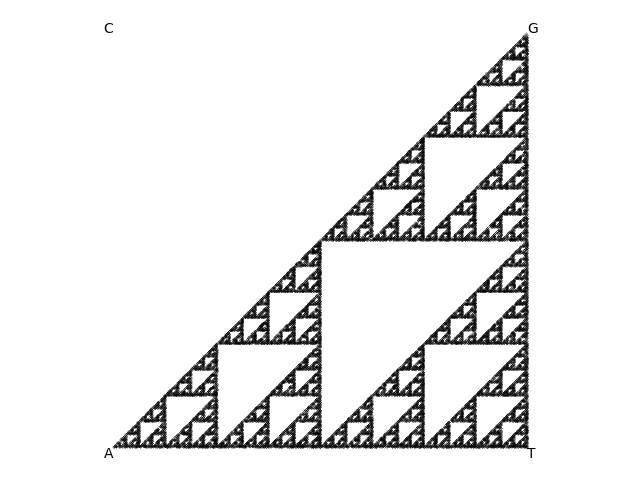 Result of Moriarty's synthetic DNA control for a sequence with no C's in it.
But as you look over his shoulder, you notice that he's also been doing some control experiments with synthetic random DNA sequences of various sorts. One of them is labeled "what happens if I generate a synthetic DNA sequence missing one nucleotide (here, no C nucleotides, sequence is A|G|T only)", and you see the plot on the right.
A second control is labeled "what happens if I generate a synthetic DNA sequence missing a dinucleotide (here, no CpG dinucleotides; sequence generated from a 1st order Markov chain with P(G|C) = 0)", and you see the next plot on the right.
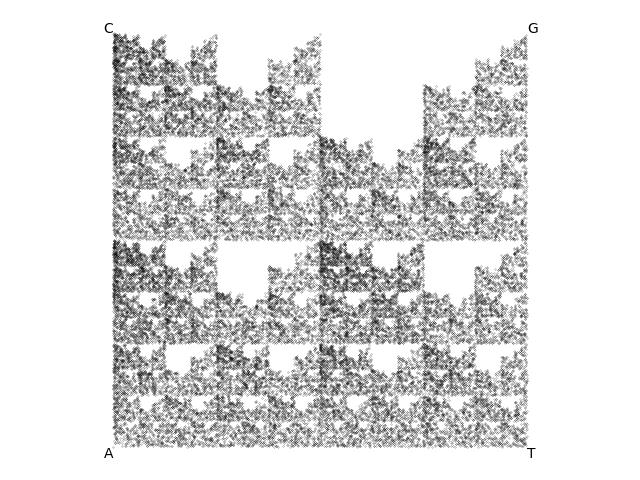 Result of Moriarty's synthetic DNA control for a sequence with no CpG
dinucleotides in it.
You start to point at these controls. You're just about to say, hey wait, I think maybe there's a really simple explanation for all these patterns, but Moriarty abruptly snaps his laptop shut and says you're obviously not smart enough to appreciate advanced fractal geometry. You ask him for his code so you can explore the data yourself, but he just walks away. You're interested in figuring out where the patterns are coming from, but you'll have to reproduce it all from scratch.
your tasks
You can download the three phage genomes in Genbank format from these three links: [BabyGotBac] [Dwayne] [Tiamoceli].
For any data file we provide to you for a pset in
the course, put it in the same directory with your Jupyter notebook.
When we grade your notebook page, we will have those same data files
in our directory too. This saves fiddling with file paths and "file
not found" problems when we run your notebook.
I'm introducing Python, numpy, and matplotlib all at once in this example. If this is your first time with Python, don't panic - the first (w01) pset only uses base Python, and we'll have until w02 before we have to use numpy and matplotlib. I'm also using functions in this example, to show how to modularize the code - you won't have to do this either in pset 01, but you may as well get used to it fast!
-
Write Python code (in your Jupyter notebook answer page) with functions to:
a) read a DNA sequence from a Genbank format file.
b) do the "chaos game" algorithm, taking a DNA sequence as input, and making a numpy 2D Lx2 array as output, where rows are points and columns are X and Y coords in the chaos game square.
c) make a figure like the examples shown here, taking the Lx2 data for the L point locations as input, and using matplotlib to make a scatterplot in a square.
-
Use your code to reproduce and show the chaos game representations of Moriarty's three phage genomes.
-
Figure out what determines the patterns in the "chaos game". Use synthetic generated random DNA sequences to test and illustrate your idea(s).
-
Design an experiment to test your idea by randomizing each of the three real phage genome sequences in a way that leaves your simple pattern, but would randomize away any other "hidden language" in the sequence.
Hint: the kind of randomization I'm looking for is a Markov model, which we won't get to until week 5 of the course: so again, don't panic, I'm using this example pset to introduce a flavor of things you'll see, not just what the first pset is going to look like.
Use only basic Python, numpy, and matplotlib in your code - no other imports.
turning in your work
If this were a real pset instead of just an opening example,
you would submit your Jupyter notebook page (a .ipynb file) to
the course Canvas page under the Assignments
tab.
You would name your
file <LastName><FirstName>_<psetnumber>.ipynb; for example,
mine would be EddySean_00.ipynb.
We will remind you of three things in each pset:
-
We grade your psets as if they're lab reports. The quality of your text explanations of what you're doing (and why) are just as important as getting your code to work. We want to see you discuss both your analysis code, and your biological interpretations.
-
Don't change the names of any of the input files you download, because the TFs (who are grading your notebook files) have those files in their working directory. Your notebook won't run if you change the input file names.
-
Remember to include a
watermarkcommand at the end of your notebook, so we know what module versions you used, in case we have to reproduce some bug exactly. For example,
%load_ext watermark
%watermark -v -m -p jupyter,numpy,matplotlib