Section 06: P-values
Notes & code adapted by Misha Gupta (2024) from Aoyue Mao, Danylo Lavrentovich, Irina Shlosman, Kevin Mizes notes from past years
In this week's lecture, we learned what p-values exactly mean. They tell us given some null hypothesis on how data is generated, how surprising a particular observation is.
This section will not focus on p-values. Instead, it will cover general features of parameter estimation, review Bayes rule, introduce the T distribution, and provide small hint for the p-set.
Optionally: There is also a Jupyter notebook that covers all of the above more densely, along with practice problems, an example p value calculation, and some interactive functions that you can run/modify to explore null vs. alternative hypotheses, visualize estimation procedures, etc. Here's the notebook: w06_section.ipynb. To run the pre-written functions you need to download this helper file: w06_section_utils.py. You are not expected to reproduce this code, this is just for you to play with.
Parameter Estimation/Inference
Given some data $D={X_1,X_2,\ldots,X_i}$, we'd like to describe the process that produced the data. Here are two example scenarios with different probability distributions.
Example 1: Weights of Siberian huskies (Normal)
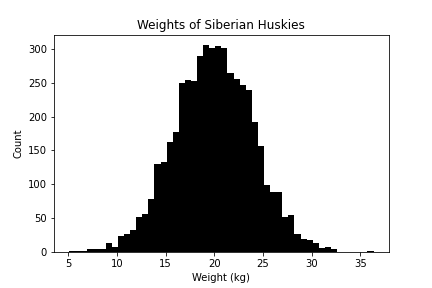
Weight is a continuous random variable. Based on our experience, it follows a normal distribution. Thus, the parameter estimation question is to ask: what particular $\mu, \sigma$ describe the data $D$?
Example 2: Number of heads out of $N$ flips of a coin (Binomial)
Every time we flip a coin, we get a heads with probability $p$, or a tails with probability $1-p$. We flipped the coin $N=30$ times. #heads is a discrete random variable and it follows the binomial distribution. We got 25 heads. We didn't know whether the coin was fair or not. So we can ask: what particular $p$ describes the number of heads?
Notation
We use $\theta$ to denote a hypothesis on how the data is generated. It is a set of particular values of the parameters of the underlying probability distribution. It may contain one or more parameters.
For dog weights (normal): $\rm \theta={\mu=20\ kg,\sigma=4\ kg}$; For an unbiased coin (binomial): $\theta={p=0.5}$.
The big question we'd like to answer: Given data $D$, what is the most probable $\theta$?
Reviewing Bayes rule
To pick out a most probable $\theta$, let's first define a set of hypotheses. Suppose we have a set of $M$ hypotheses, $\theta_1, \dots, \theta_M$. Given data, how probable is a particular hypothesis $\theta_k$?
This sounds like a conditional probability... which means it's time to stare at Bayes rule:
$P(\theta_k \mid D) = \frac{P(D\mid \theta_k)P(\theta_k)}{P(D)}$
Let's review the terms:
- $P(\theta_k \mid D)$ is the posterior. How probable is the hypothesis post seeing the data?
- $P(D\mid \theta_k)$ is the likelihood. How probable is the data, given that the hypothesis is true?
- $P(\theta_k)$ is the prior. How probable is the hypothesis, prior to seeing the data?
- $P(D)$ is the marginal. Or it might be called a normalization factor. How probable is the data under all possible hypotheses?
What is this $P(D)$? Reviewing marginalization
$$ \begin{aligned} P(D) &= P(D \text{ and }\theta_1) + P(D \text{ and }\theta_2) + \dots + P(D \text{ and }\theta_M) \ &= \sum_{i=1}^M P(D \text{ and }\theta_i) \ &= \sum_{i=1}^M P(D \mid \theta_i) P(\theta_i) \ \end{aligned} $$
Here we've assumed there's a finite number of hypotheses. If we have an infinite number, you could see the marginal written as something like $P(D) = \int P(D \mid \theta') P(\theta') d\theta'$.
Practice Problem: Mosquito's Blood Preference
ABO blood types exist in different frequencies in the human population. (At least some say that) they also attract mosquitos differently.
| Blood type | Frequency in population | Mosquito landing chance |
|---|---|---|
| A | 0.42 | 0.453 |
| B | 0.10 | 0.569 |
| AB | 0.04 | 0.480 |
| O | 0.44 | 0.785 |
Compute the following terms (just to get on top of Baye's rules).
- $P(\text{Landing}\mid \text{B type})$
- $P(\text{Landing})$
- $P(\text{O type}\mid\text{Landing})$
- $P(\text{AB type}\mid\text{Not landing})$
Comparing two hypotheses
I forgot my exact blood type, but I'm sure it is either A or O. And I was bitten by a mosquito today. How is this reflected in the posteriors?
$$ P(\text{A type}\mid \text{Landing})=\frac{P(\text{Landing}\mid \text{A type})P(\text{A type})}{P(\text{Landing})} $$
$$ P(\text{O type}\mid \text{Landing})=\frac{P(\text{Landing}\mid \text{O type})P(\text{O type})}{P(\text{Landing})} $$
To compare these two hypotheses, I can take a ratio of their posterior probabilities. The denominator $P(\text{Landing})$ cancels out.
Generally speaking, when we look for the hypothesis with the highest $P(\theta \mid D)$, we can ignore the denominator, since it's unaffected by hypotheses.
- If we have some prior beliefs $P(\theta)$, the $\theta$ that maximizes $P(D\mid \theta)P(\theta)$ is the maximum a posteriori (MAP) estimation. This is a point estimate of the parameters.
- If we further assume uniform priors $P(\theta)$ on all $\theta$, then $P(\theta \mid D) \propto P(D\mid \theta)$. Now, the $\theta$ that maximizes $P(D\mid \theta)$ (a.k.a. likelihood) is the maximum likelihood estimation (MLE).
- Small note on notation: The likelihood $P(D \mid \theta)$ is a term that conveys how probable data is, given a world in which $\theta$ is true. It is a measure of how likely it is we'd observe the data $D$ if the data was generated by a process parameterized by $\theta$. With that in mind, the likelihood $P(D \mid \theta)$ is often expressed only as a function of $\theta$, looking like $L(\theta)$ or $l(\theta)$. In this notation, $\theta$ is an input, it's a particular parameter setting that we assume in some state of the world, and the data is treated as fixed, observed values. So don't forget that if you see notation like $L(\theta)$, it represents how likely it is that some observed data was generated by a process parameterized by $\theta$.
Concepts behind likelihood $P(D \mid \theta)$ with binomial
Binomial process: we run $n$ trials, with each trial having a success probability $p$, and we count how many successes we get out of the $n$ trials.
The probability mass function: (The probability of getting $k$ successes)
$$ P(k \mid p, n) = {n \choose k} p^k (1-p)^{n-k} $$
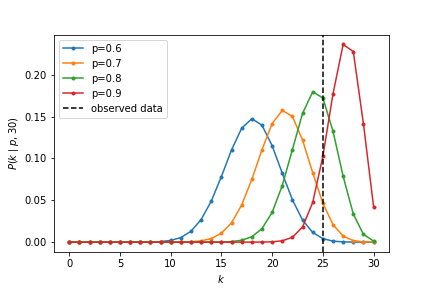
The likelihood $L(p) = P(k=25 \mid n=30,p)$ depends on $p$. We can do MLE analytically in this binomial case. A convenient trick that comes up frequently with this kind of problem is to maximize the log likelihood instead of the likelihood. This is okay to do because the logarithm is a monotonically increasing function (the $x$ that maximizes $f(x)$ also maximizes $\log f(x)$). Exponents come up a lot in statistics formulas, and taking the log helps to separate them out.
The log likelihood:
$$ \begin{aligned} \log L(p) &= \log \bigg[ {n \choose k}p^k (1-p)^{n-k}\bigg] \ &= \log {n \choose k}+ k \log(p) + (n-k)\log(1-p) \end{aligned} $$
Now it's a little easier to take the derivative with respect to $p$:
$$ \begin{aligned} \frac{\partial}{\partial p} \log L(p) &= \frac{\partial}{\partial p} \bigg[ \log {n \choose k}+ k \log(p) + (n-k)\log(1-p) \bigg] \ &= \frac{k}{p} - \frac{n-k}{1-p} \end{aligned} $$
Setting it to zero to find our maximizer, $\hat{p}$ (you should check it's a maximum by taking the second derivative too):
$$ \frac{k}{p} - \frac{n-k}{1-p} = 0 \implies k - kp = np - kp \implies \hat{p} = \frac{k}{n} $$
This $\hat{p}$ is our estimate of the parameter we were looking for, and in this case fully specifies our $\theta$. Rather unsurprisingly, in a coin flip system, if we observe $k$ heads out of $n$ flips, the maximum likelihood estimate of the probability of heads is just $k/n$.
We can also plot $\log L(p)$ against $p$. Clearly, there exists a maximum.
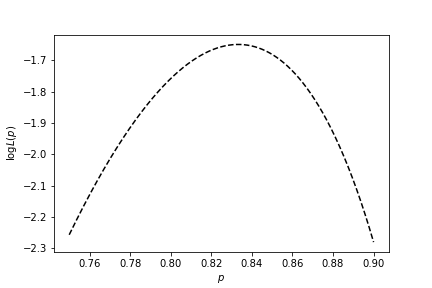
We find the probability mass function curve for this MLE. It indeed has the most overlap with the observed data.
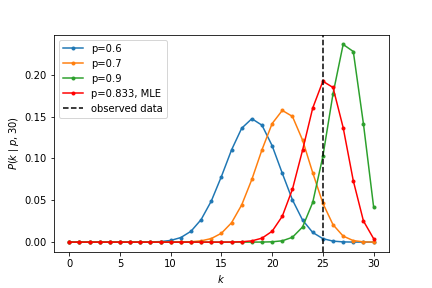
A few things to consider:
- Does this mean the null hypothesis (fair coin) is invalidated? No: this is the just the most likely estimate.
- Does this mean $p=k/n$ has to be the correct model? No: this is just the most likely model!
MLE for the normal distribution
Now let's switch gears to something a little more involved. Suppose we observe $n$ data points where $D = x_1, \dots, x_n \sim N(\mu, \sigma)$. Just as we did for binomial distribution, let's try to maximize the likelihood of the observed data with respect to the parameters that describe it. The $\theta$ would involve 2 parameters, $\mu$ and $\sigma$.
For a single point $x$, the normal probability density function (pdf for continuous distributions; pmf for discrete distributions) is
$$ P(x| \mu, \sigma^2) = \frac{1}{\sqrt{2\pi\sigma^2}} e^{-\frac{(x-\mu)^2}{2\sigma^2}} $$
The joint probability of $n$ points, assuming they are all independently, identically distributed:
$$ \begin{aligned} P(x_1, \dots, x_n \mid \mu, \sigma^2) &= P(x_1 \mid \mu, \sigma^2)\cdot P(x_2 \mid \mu, \sigma^2)\dots P(x_n \mid \mu, \sigma^2) && \text{assume data is IID} \ &= \prod_{i=1}^n P(x_i \mid \mu, \sigma^2) && \text{use index notation} \ &= \prod_{i=1}^n \frac{1}{\sqrt{2\pi\sigma^2}} \exp\big(-\frac{(x_i-\mu)^2}{2\sigma^2} \big) && \text{plug in PDF}\ &= \bigg(\frac{1}{\sqrt{2\pi\sigma^2}}\bigg)^n \times \bigg[ \prod_{i=1}^n \exp\big(-\frac{(x_i-\mu)^2}{2\sigma^2} \big) \bigg] && \text{pop out the constant from the product}\ &= \big(2\pi\sigma^2\big)^{-\frac{n}{2}} \times \bigg[ \prod_{i=1}^n \exp\big(-\frac{(x_i-\mu)^2}{2\sigma^2} \big) \bigg]&& \text{rewrite constant a little bit} \ &= \big(2\pi\sigma^2\big)^{-\frac{n}{2}} \times \exp\bigg( -\sum_{i=1}^n \frac{(x_i-\mu)^2}{2\sigma^2} \bigg) && \text{product of exps is exp of sum}\ \end{aligned} $$
At this point it will be convenient to take the log again:
$$ \begin{aligned} \log P(x_1, \dots, x_n \mid \mu, \sigma^2) &= \log \bigg[ \big(2\pi\sigma^2\big)^{-\frac{n}{2}} \times \exp\bigg( -\sum_{i=1}^n \frac{(x_i-\mu)^2}{2\sigma^2} \bigg) \bigg] \ &= -\frac{n}{2}\log\big(2\pi\sigma^2\big) + \log \bigg[ \exp \bigg( -\sum_{i=1}^n \frac{(x_i-\mu)^2}{2\sigma^2} \bigg) \bigg] \ &= -\frac{n}{2}\log\big(2\pi\sigma^2\big) - \sum_{i=1}^n \frac{(x_i-\mu)^2}{2\sigma^2} \ \end{aligned} $$
MLE of $\mu$
$$ \begin{aligned} \frac{d}{d\mu} \log P(x_1, \dots, x_n\mid \mu, \sigma^2) &= 0 \ \frac{d}{d\mu} \bigg( -\frac{n}{2}\log\big(2\pi\sigma^2\big) - \sum_{i=1}^n \frac{(x_i-\mu)^2}{2\sigma^2} \bigg ) &= 0 \ \sum_{i=1}^N \frac{-\frac{d}{d\mu} (x_i-\mu)^2}{2\sigma^2} &= 0 \ \sum_{i=1}^N \bigg( \frac{x_i-\mu}{\sigma^2} \bigg) &= 0 \end{aligned} $$
Multiplying both sides by $\sigma$ and rearranging gives us our likelihood-maximizing $\mu$:
$$ \hat{\mu} = \frac{\sum_{i=1}^n x_i}{n} $$
The maximum likelihood estimate of the mean given some observed $x_i$'s is the sample mean.
MLE of $\sigma^2$
$$ \begin{aligned} \log P(x_1, \dots, x_n \mid \mu, \sigma^2) = \log L(\mu, \sigma^2) = -\frac{n}{2}\log\big(2\pi\sigma^2\big) - \sum_{i=1}^n \frac{(x_i-\mu)^2}{2\sigma^2} \ \end{aligned} $$
Taking derivative wrt $\sigma^2$:
$$ \frac{\partial}{\partial\sigma^2} \log L(\mu, \sigma^2) = -\frac{n}{2\sigma^2} + \sum_{i=1}^n \frac{(x_i-\mu)^2}{2(\sigma^2)^2} = 0 $$
Skipping some steps here (it is a good exercise to do these calculations by hand), we arrive at our estimate:
$$ \hat{\sigma^2} = \frac{1}{n}\sum_{i=1}^n (x_i-\mu)^2 $$
This expression is not too surprising -- it's the average squared distance from the mean over all data points. These are values we can get from data!
Estimation of Gaussian parameters only given data... the road to the T-distribution
Let's say we observe some small number of data points $x_1, \dots, x_n$ (around $n=5$) that we assume are generated by a Gaussian process, $x_1, \dots, x_n \sim N(\mu, \sigma^2)$, and we'd like to use the data to estimate $\mu$ and $\sigma$.
From our analysis above,
- the maximum likelihood estimator for the mean is the sample mean: $\hat{\mu} = \bar{x} = \frac{1}{N} \sum_{i=1}^n x_i$
- the maximum likelihood estimator for the variance is: $\hat{\sigma^2} = \frac{1}{n} \sum_{i=1}^n (x_i - \mu)^2$
Wait a second. The MLE for the variance includes $\mu$, something we're trying to estimate with $\bar{x}$!
If we plug in $\bar{x}$ for $\mu$ to get a new estimator for the variance, $\hat{\sigma^2} = \frac{1}{n} \sum_{i=1}^n (x_i - \bar{x})^2$, it turns out that this estimator is biased. What does this mean exactly?
An estimator $\hat{\theta}$ of a parameter $\theta$ is a function of data and is biased if the expected value of $\hat{\theta}$ over all possible data is not exactly $\theta$. A small correction is needed to yield an unbiased estimator of the population variance: $\frac{1}{n-1}$ rather than $\frac{1}{n}$. This is the Bessel correction -- you can read more about it here and here.
So, given some data, an unbiased estimator of the population variance is the (Bessel-corrected) sample variance, $S^2 = \frac{1}{n-1}\sum_{i=1}^n (x_i - \bar{x})^2$
Hypothesis testing on $\bar{x}$
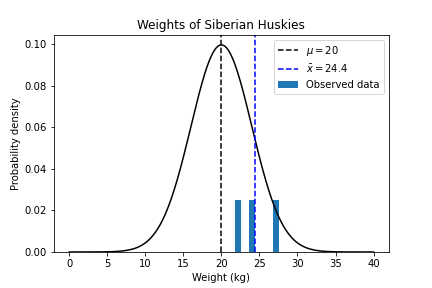
Q: This is the value that maximises our Log Likelihood. But. How likely is it that we'd get this particular $\bar{x}$ value?
$\bar{x}$ has a variance of $\frac{\sigma^2}{n}$; so the "standard error of the mean" is $\frac{\sigma}{\sqrt{n}}$. $\bar{x}$ is then turned into a standard score:
$$ \frac{\bar{x}-\mu}{\sigma/\sqrt{n}} $$
- If $\sigma$ is known, this is a Z score
$$ Z=\frac{\bar{x}-\mu}{\sigma/\sqrt{n}} $$
The Z score also follows a normal distribution.
- If $\sigma$ is unknown, we estimate it with $s$ (sample standard deviation). This becomes a T score
$$ T=\frac{\bar{x}-\mu}{s/\sqrt{n}} $$
with $n-1$ degrees of freedom, and it no longer follows the normal distribution. Instead, it follows a Student's t distribution with $n-1$ degrees of freedom.
Distributions of Z and T scores
https://www.scribbr.com/statistics/t-distribution/

- T distribution has fatter tails. It allows for $\bar{x}$ to be "far away" from $\mu$ because we had to estimate $\sigma^2$ from the data.
- We could have estimated too small a $\sigma^2$, which means the T score would be larger than it should be. Hence, more probability of big T scores.
- At large $n$, we estimate $\sigma^2$ well, so T distribution converges to Z distribution.
So T distributions can arise from estimation of an unknown $\sigma^2$ given data. In the pset, we will marginalize over many potential $\sigma^2$.
Concepts for pset
Inferring $(\mu,\sigma)$ of a normal distribution. The true values are from finite choices. For each candidate $(\mu,\sigma)$, calculate the posterior $P(\mu,\sigma \mid x_1, \ldots, x_n)$.